“The United States exhibits significant variation in average mortgage rates across states, with New Jersey topping the list at 6.85% and Idaho at the bottom with 4.35%, reflecting differences in local housing markets, borrower profiles, and historical refinancing trends as of recent data. Key low-rate states include Idaho, Hawaii, Utah, California, and Arizona, all under 4.61%, while high-rate areas like New Jersey, Nebraska, Connecticut, Texas, and New Hampshire range from 6.37% to 6.85%. These disparities influence affordability, homeownership costs, and regional economic dynamics in the housing sector.”
Regional Variations in Mortgage Rates
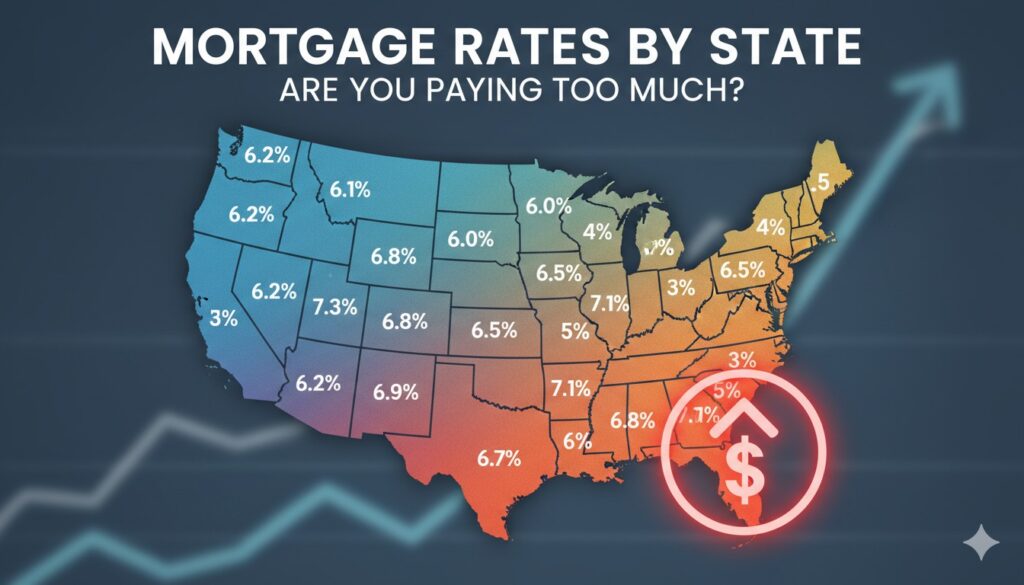
The map highlights distinct regional patterns in average mortgage rates, where coastal and urban-heavy states often show different averages compared to midwestern or western rural areas. For instance, states in the Northeast and parts of the Midwest tend to have higher averages, potentially due to more recent home purchases or refinances during periods of elevated national rates. In contrast, western states with longstanding homeowners who locked in lower rates years ago pull down the overall state averages.
Factors Influencing State-Level Differences
| State | AverageRate | QuarterlyChange |
|---|---|---|
| NewJersey | 6.85% | -8.86% |
| Nebraska | 6.50% | -14.20% |
| Connecticut | 6.48% | -9.30% |
| Texas | 6.44% | -7.71% |
| NewHampshire | 6.37% | -10.36% |
| Kansas | 6.35% | -13.58% |
| NewYork | 6.25% | -9.05% |
| Florida | 6.20% | -10.45% |
| Illinois | 6.20% | -10.82% |
| Louisiana | 5.96% | -14.88% |
| Oklahoma | 5.90% | -13.45% |
| RhodeIsland | 5.78% | -9.87% |
| Massachusetts | 5.73% | -9.07% |
| Georgia | 5.67% | -10.62% |
| SouthDakota | 5.59% | -12.85% |
| Minnesota | 5.58% | -10.72% |
| Ohio | 5.54% | -15.91% |
| Maryland | 5.51% | -11.12% |
| Missouri | 5.51% | -14.13% |
| Pennsylvania | 5.47% | -13.28% |
| Iowa | 5.46% | -16.35% |
| Montana | 5.38% | -12.52% |
| Vermont | 5.38% | -6.73% |
| Michigan | 5.37% | -12.95% |
| Mississippi | 5.35% | -16.47% |
| Washington | 5.34% | -10.30% |
| Colorado | 5.27% | -10.52% |
| NorthDakota | 5.16% | -13.75% |
| Virginia | 5.16% | -12.91% |
| Alaska | 5.15% | -12.95% |
| Maine | 5.13% | -13.07% |
| NewMexico | 5.13% | -15.18% |
| Kentucky | 5.11% | -14.07% |
| Indiana | 5.06% | -16.34% |
| Wisconsin | 5.03% | -8.43% |
| NorthCarolina | 5.02% | -14.36% |
| Arkansas | 4.98% | -15.73% |
| Wyoming | 4.98% | -10.07% |
| Oregon | 4.96% | -11.15% |
| SouthCarolina | 4.88% | -13.85% |
| Alabama | 4.82% | -16.65% |
| Tennessee | 4.79% | -13.08% |
| Delaware | 4.65% | -15.80% |
| Nevada | 4.61% | -13.28% |
| WestVirginia | 4.58% | -13.29% |
| Arizona | 4.56% | -13.86% |
| California | 4.56% | -9.42% |
| Utah | 4.54% | -11.76% |
| Hawaii | 4.48% | -8.87% |
| Idaho | 4.35% | -14.24% |
Several elements contribute to these state-specific averages. Housing market turnover plays a major role; states with high migration or frequent sales, such as Texas and Florida, often see averages skewed toward recent national rate levels. Conversely, areas with stable populations and fewer refinances, like Idaho or Hawaii, retain a larger share of older mortgages from low-rate eras, depressing the state average.
Economic conditions also factor in. States with robust job markets and higher incomes, such as California and New York, may have borrowers who refinanced during dips, but the map shows mixed results. Regulatory environments vary too—some states have higher closing costs or taxes that indirectly affect effective rates, though the map focuses on base interest.
Quarterly changes reveal downward trends across the board, with Mississippi experiencing the steepest drop at -16.47%, indicating aggressive refinancing or market adjustments. States like Iowa and Alabama follow closely, suggesting broader economic relief in the Midwest and South.
Impact on Homebuyers and Homeowners
For prospective buyers, lower average rates in states like Idaho translate to substantial savings. On a $300,000 loan, a 4.35% rate yields monthly payments around $1,493, compared to $2,040 at New Jersey’s 6.85%—a difference of over $547 monthly, or more than $197,000 over 30 years.
Homeowners in high-rate states might consider refinancing if national trends continue downward, potentially aligning their personal rates closer to the lower end of the spectrum. The map underscores opportunities for equity building in low-rate regions, where property values may appreciate faster due to affordability.
Key Points from the Map
Northeast Dominance in High Rates : New Jersey, Connecticut, and New Hampshire lead with averages above 6.37%, possibly due to urban density and recent market activity.
Western States’ Advantage : Idaho, Hawaii, Utah, and California boast rates under 4.61%, benefiting from historical low-rate locks and slower turnover.
Midwest Volatility : States like Iowa (-16.35%) and Mississippi (-16.47%) show the largest declines, signaling rapid adjustments to economic shifts.
Southern Affordability Boost : Alabama, Tennessee, and South Carolina averages below 4.88% enhance housing accessibility amid population growth.
National Context : While state averages vary, the overall U.S. trend points to stabilization around mid-5% levels, influenced by federal policy and inflation controls.
Economic Implications for Regions
The map’s data suggests broader economic narratives. High-rate states may face slower home sales, impacting related industries like construction and real estate services. In contrast, low-rate areas could see increased investment, driving up property taxes and local revenues.
Lenders operate differently by region; national banks might offer uniform rates, but local credit unions in low-average states provide competitive edges. Borrowers should shop across lenders, as personal credit, down payments, and loan types can yield rates deviating from state averages.
## Detailed Breakdown by Region